ZAR/USD Calendar Year Moves
June 16, 2023
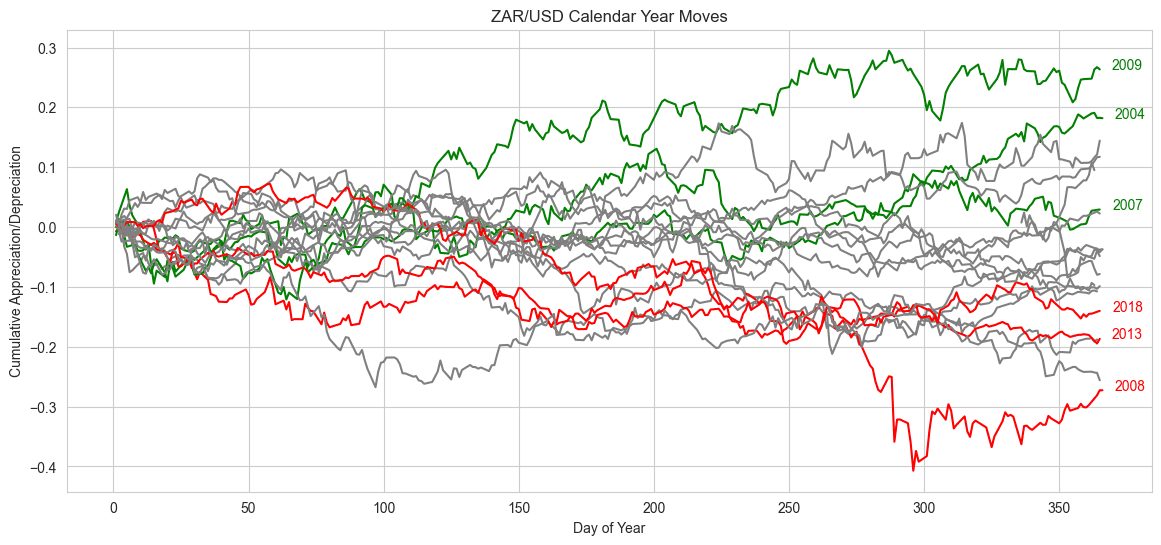
I saw a post on LinkedIn which illustrated the cumulative appreciation/depreciation of the rand relative to the US dollar for each calendar year since 1990. I thought it would be fun to recreate it.
The data is from the beginning of 2003 until the end of 2022 (I haven't checked or accounted for missing data points and imputations).
Here's the code:
import datetime

import matplotlib.pyplot as plt
import pandas as pd
import seaborn as sns
import yfinance as yf


sns.set_style("whitegrid")
fig = plt.figure(figsize=(14, 6))

start_date = datetime.date(2003, 1, 1)
end_date = datetime.date(2022, 12, 31)

# fetch data
forex_data = yf.download("ZARUSD=X", start=start_date, end=end_date, interval="1d")

# convert index to datetime
forex_data.index = pd.to_datetime(forex_data.index)

# calculate daily returns
forex_data["daily_return"] = forex_data["Close"].pct_change()

# define random list of years to include in legend
legend_years = [2004, 2007, 2008, 2009, 2013, 2018, 2022]

# create a plot for each year
for year in range(start_date.year, end_date.year):
    forex_data_year = forex_data.loc[str(year)].copy()
    forex_data_year["cumulative_return"] = (1 + forex_data_year["daily_return"]).cumprod() - 1

    if year in legend_years:
        if forex_data_year["cumulative_return"].iloc[-1] >= 0:
            color = "green"
        else:
            color = "red"
        plt.plot(forex_data_year.index.dayofyear, forex_data_year["cumulative_return"], color=color)
        plt.annotate(
            year,
            (forex_data_year.index.dayofyear[-1], forex_data_year["cumulative_return"].iloc[-1]),
            textcoords="offset points",
            xytext=(20, 0),
            ha="center",
            color=color,
        )
    else:
        plt.plot(
            forex_data_year.index.dayofyear, forex_data_year["cumulative_return"], color="grey"
        )

plt.title("ZAR/USD Calendar Year Moves")
plt.xlabel("Day of Year")
plt.ylabel("Cumulative Appreciation/Depreciation")
plt.savefig("forex_data.png", bbox_inches="tight")
plt.show()